You are here: How to show Google Analytics reports on your public website
How to show Google Analytics reports on your public website

Google Analytics was made to monitor your website traffic but many other uses were emerged as developers loved this free data collection and reporting platform. You can use Google Analytics to monitor desktop software usage, the usage of mobile apps, and many other wierd things, like for example your front door at the office.
Sometimes you do not want to keep the collected data to yourself and want to show them also to the visitors of your website. There are several ways to do this.
Tools and methods to show data on the public site (viewed by anonymous users)
| Tool | Description | Advantages | Disadvanages |
|---|---|---|---|
| Google Embed API via a Service account | You need to create a new "Service account" and create your visualizations with the Embed API. Set the "Service account" as the public user who looks at your visualizations. |
|
|
| Google Analytics superProxy |
Allows you to publicly share your Google Analytics reporting data. You can use it to power your own custom dashboards and widgets, transform responses to various formats. You can use the Query Explorer to generate reports and then copy the Query URI to use with the Google Analytics superProxy |
|
|
| Databox |
|
|
|
| EmbeddedAnalytics | Free plan limited to 1 chart | ||
| Google Analyticator for Wordpress | Easy installation as a Wordpress plugin | Shows only a standard dashboard. | |
| Tableau | To be reviewed. Not clear if the Google Analytics data are re-fetched periodically or it is an one-time import. |
|
|
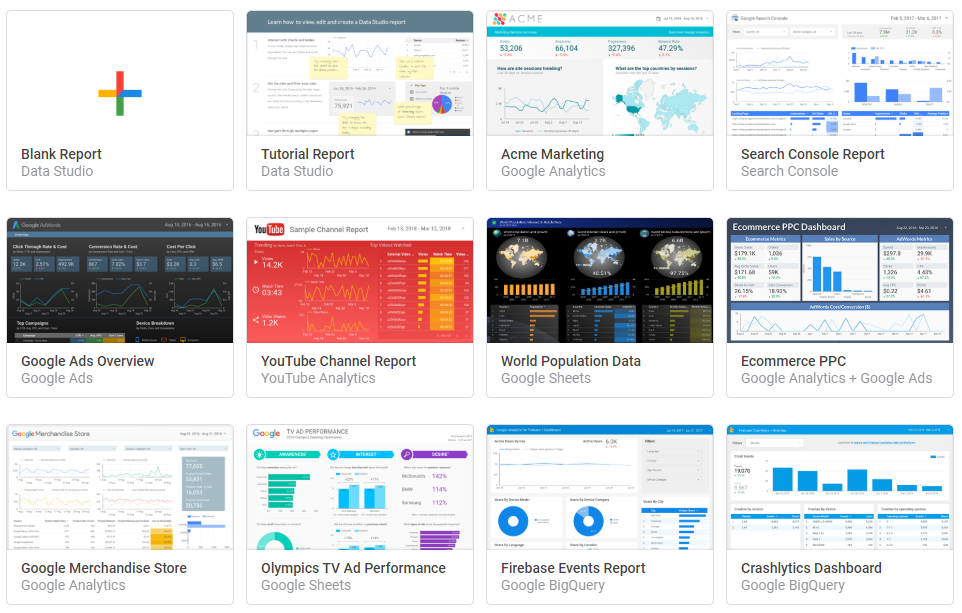
| Google Data Studio |
|
|
After a quick review of this list, we chose Google data studio for the benefits listed above.
How to build a public analytics dashboard via the Google Data Studio
1. You can log in to Google Data studio using the same account as in Google Analytics.
2. Authorize Data studio to access the GA account so that your analytics data pass through.
3. You will be presented with some dashboard templates that answer basic analytics questions.
4. You can also create a completely new dashboard.
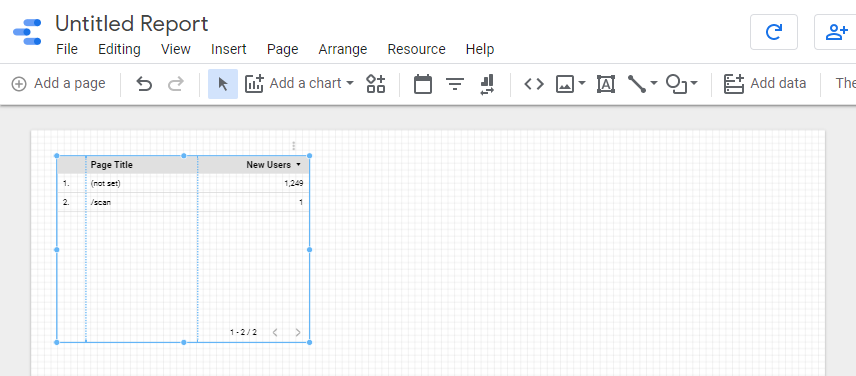
5. Creating a dashboard is a drag-and-drop task, where you select from the available widgets (bar charts, pie charts, timelines, pivot tables, etc).
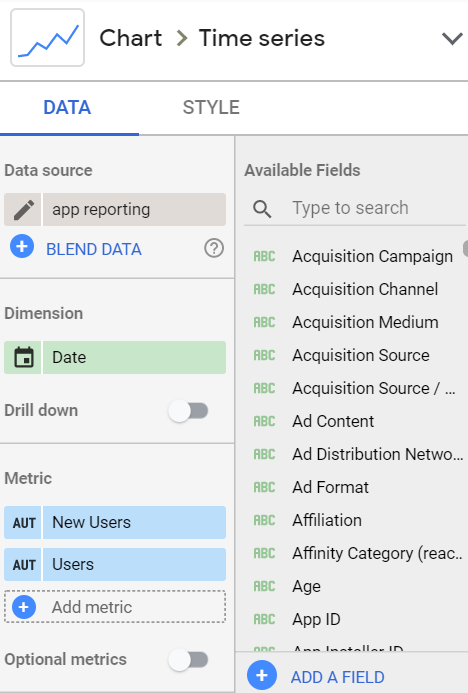
6. After you place a widget on the dashboard you can modify its properties, e.g. date range, what data to display, colours to use, and even link drill-down reports.
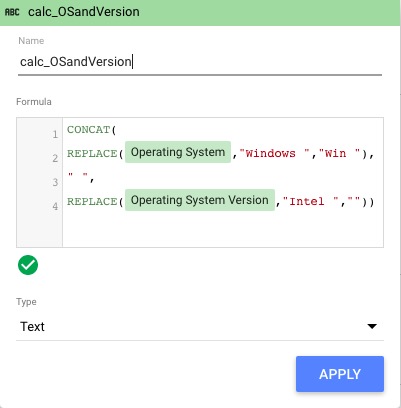
8. You can create calculated fields, for example, combine the dimensions Operating system and Operating system version to present graphs by the complete OS and version.
In about 30' we had our first public dashboard with Google Analytics reports ready. View it online.
Add new comment