You are here: Google analytics reporting examples for tracking software/shareware desktop applications
Google analytics reporting examples for tracking software/shareware desktop applications
As a shareware developer, you are probably already using Google analytics for your website traffic as it is a free and reliable solution.
By using SoftMeter for Google Analytics in your shareware/software application you can see run-time statistics of your program via the usual Google Analytics platform.
Because Google Analytics is purposed to measure website traffic and website users/visitors, the labels of some of the figures are slightly different when you monitor the usage of your software.
| Google Analytics term | SoftMeter term | Comments | |
|---|---|---|---|
|
Website (for Website properties) |
→ | Your desktop program (software application) | |
| Browser | → | The name of your software program ( see also AppName below) | |
| User or visitor | → | Installation | For every installation, SoftMeter generates a unique anonymous UserID, that can also be thought as MachineID. Therefore, Google Analytics figures about Users, we can be considered as Installations. |
| New users | → | New installations | |
| Session or visit | → | A program use. | A session starts when the user launches your program (assuming that you send a hit at that time) and lasts until the user exits your program or stops using it for more than 30 minutes. |
| Session duration | → | How long a user is actively using your program. | |
| Google analytics hits | |||
| You can send to G.A. these types of hits from inside your desktop software. | |||
| Pageview | → | Pageview hit | Appears in "Website" types of reporting views. |
| Screenview | → | Screenview hit | Appears in "Mobile App" types of reporting views. |
| Event | → | Event hit | Appears in "Website" and "Mobile App" types of reporting views. |
| Exception | → | Exception hit. How to track your program's exceptions or crashes via Google analytics. | Appears in "Mobile App" types of reporting views. |
| Field mapping between SoftMeter and Google Analytics | |||
| Computer parameters | |||
| Screen resolution | → | Screen resolution | |
| Campaign medium | → | User's operating system | Until v.0.6.4 |
| Operating system | → | User's operating system (e.g. MacOs, Windows) | |
| Operating system version | → | User's operating system version (e.g. 8, 8.1, 7, 10, 10.13) | |
| Location | → | Location (country, city) of your users | |
| Language | → | User's preferred language from the computer settings | |
| Total computer memory | |||
| Application information | |||
| AppID | → | Your app's edition / Your app's license (e.g. Windows / Trial, MacOS / Paid, etc) | Combined field with these two (free text) parameters |
| Campaign source | → | Your application name and version | Until v0.6.4 |
| App Name | → | Your application name | |
| App Version | → | Your application version | |
| Campaign medium | → | Your application edition | Since v0.90. E.g. Enterprise, CLI, etc |
| Campaign source | → | Your application license | Since v0.90. E.g. Free, Lite, Pro |
| SoftMeter library information | |||
| Data source | → | SoftMeter library name and version | |
| Unused parameters | |||
| Campaign name | |||
| Referrer | |||
| Demographics | |||
Below you can see some common questions the developers have and their answers as provided by the reports of Google analytics.
- 1. How many people install or uninstall my software per month? Under which OS are the most uninstallations?
- In Google Analytics you can easily create a custom report that shows all these data.
We created such a report and shared its template titled "Installs vs uninstalls of desktop software" via the Google Analytics solutions gallery. You can import it from there, into your G.A. property.
Below are some sample screenshots showing the installation statistics of our own shareware software. 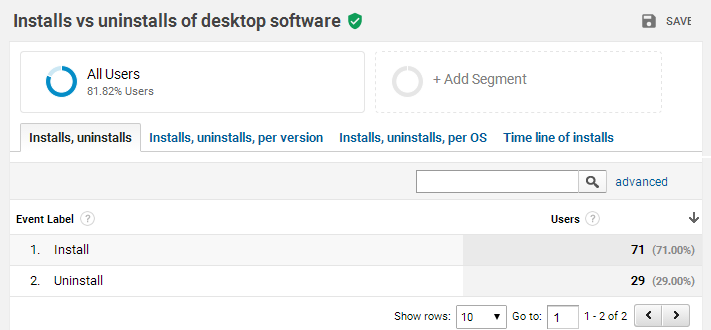
- 2. Does my program run ok or does it crash at the end-users' computers?
- You can catch the exceptions inside your program and send them as "Exception" and "Crash" hits to Google Analytics.
You can then see the crashes in combination with the OS, the screen resolution and your application version to extract your conclusions about the bug.
Read more at: How to track your program's exceptions or crashes via Google analytics.
Example report in Google Analytics showing the application's crashes and exceptions.
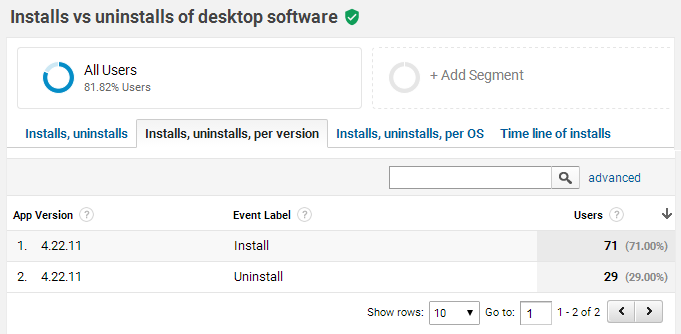
- 3. How many installations each version of my software has? Which are the operating systems of my users? How many free vs paid installations do I have?
- If you have created a Mobile App reporting view in Google Analytics, you can see the App version (of your desktop or mobile application) with the standard reports.
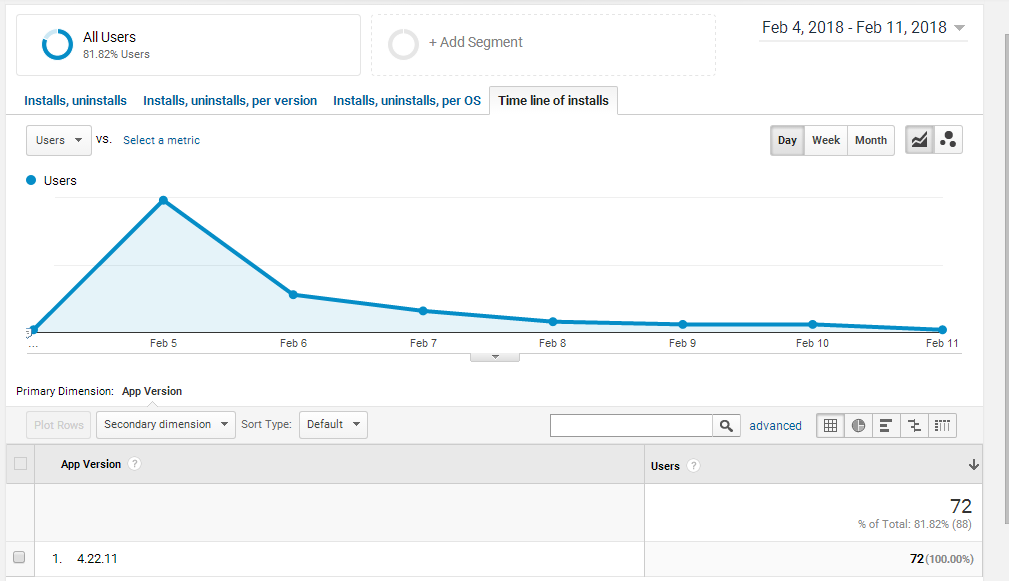
-
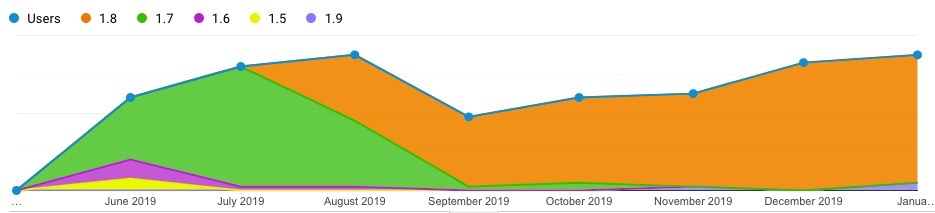
Timeline evolution of the users vs the application version of your software. On the top, you see the version numbers.
- In Google Analytics you can easily create a custom report that shows multiple telemetry data.
We created such a report and shared its template via the Google Analytics solutions gallery. You can import it from there, into your G.A. property.
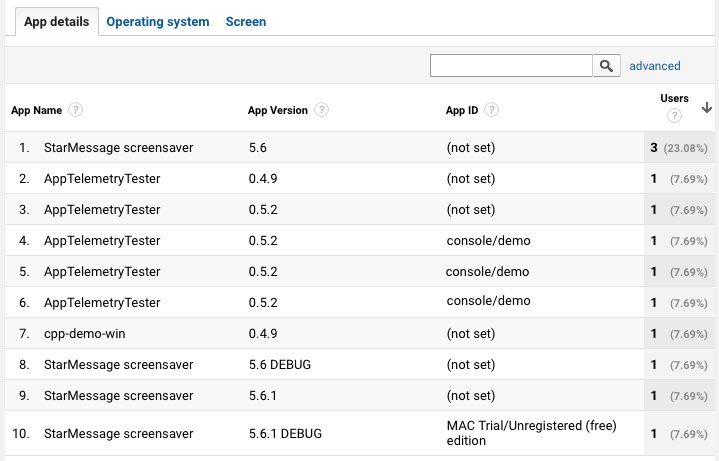
Installations per application, application version and edition
For the App ID field, the library sends the appEdition combined with the appLicense.
Example values (free text) that you can use:
- for the appEdition: Standard, Mac, Win, Special Build, etc.
- for the appLicense: Free, Paid, Full, Trial, etc.
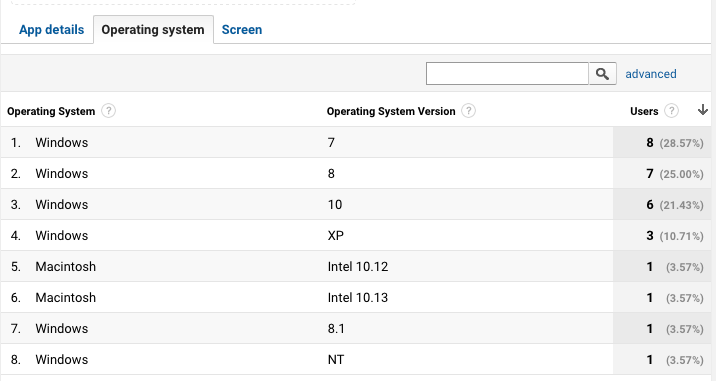
Which operating systems do your users have?
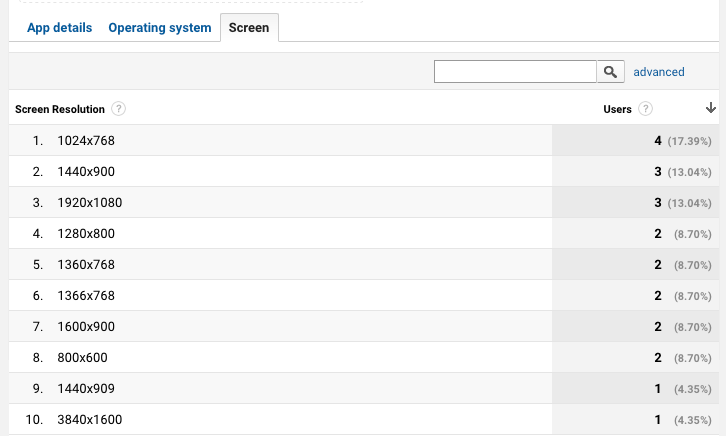
Screen resolutions
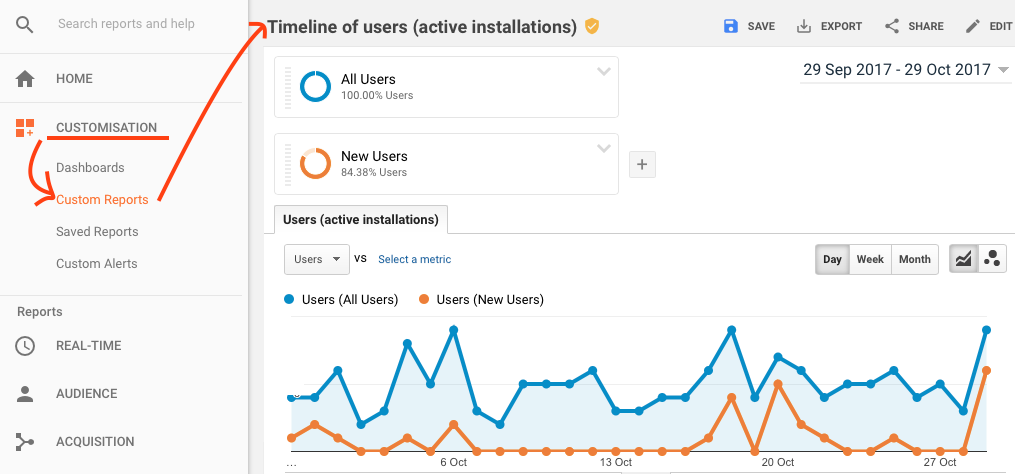
- 4. What is the number of my users (active installations) over time?
- Import our custom report template "Timeline of users (active installations)" from the Google Analytics gallery. to see how the number of you users evolves over time.
- 5. What information can I have about the users of my software?
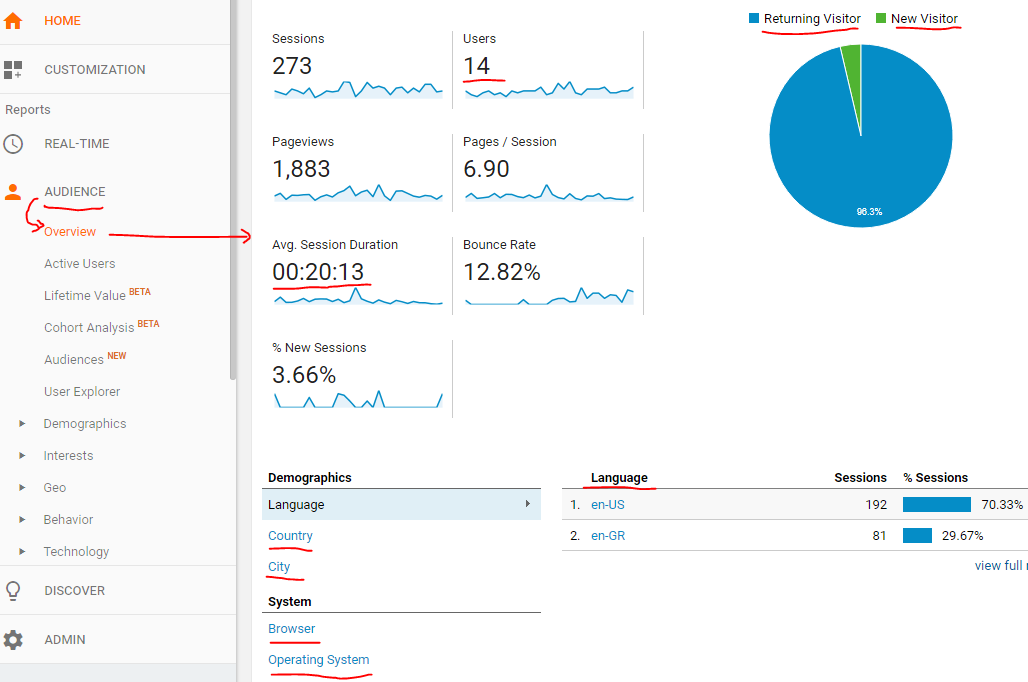
Under the "Audience" section, go to overview.
For the selected period of time you will see:
the total number of users
the average time they use your application (agv. session duration)
if the users are new or existing users
the users' country, city, language, operating system, and your application name and version (Browser)
- 6. How many users are running my software right now?
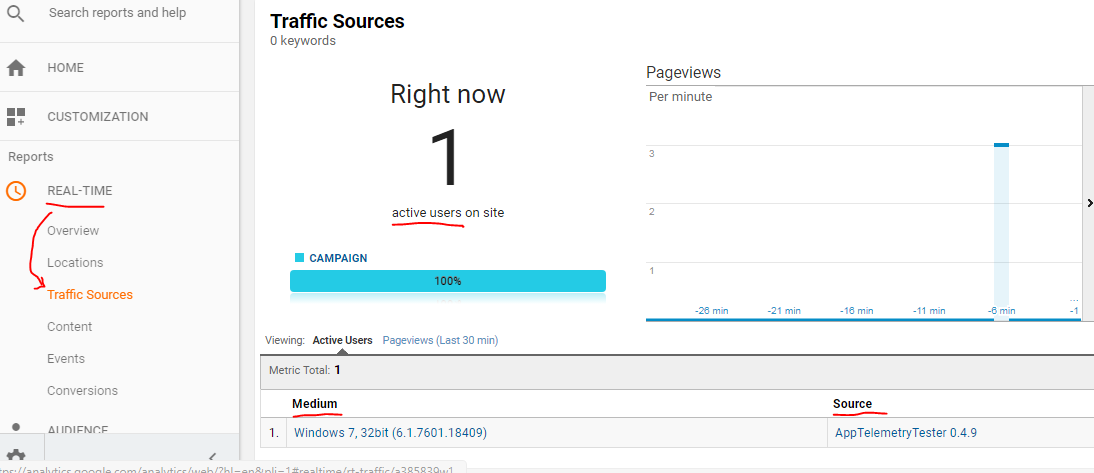
Go to the real-time section and then to traffic sources. Yoy will see:
- the number of users in the last 30min,
- The user's operating system and version (under Medium)
- Your program's name and version under Source.
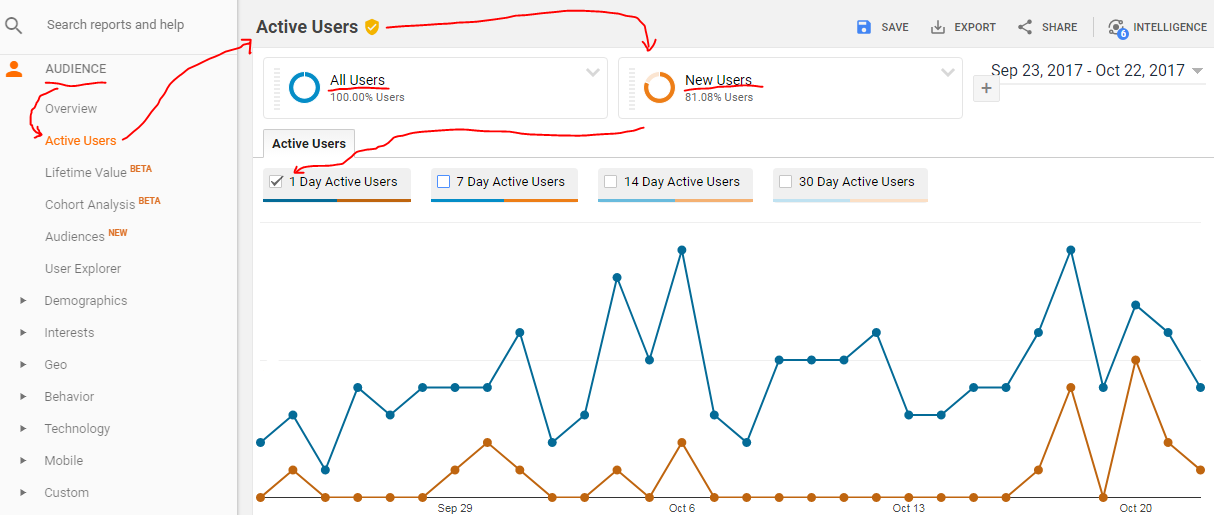
- 7. How many active installations does my software have?
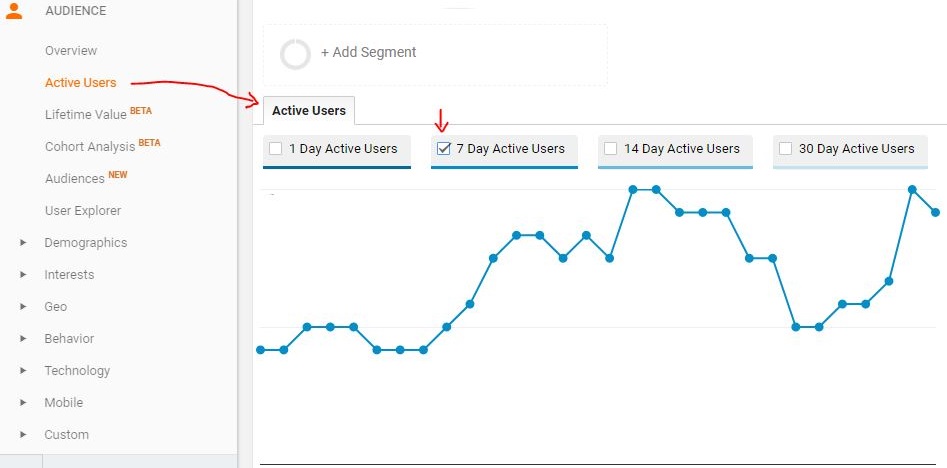
For each installation, SoftMeter creates a unique anonymous userID, so Google analytics will report every Installation of your software as a User.
The number of Installations is the number of Users.
Under "Audience" / "Active users" you can see how many users have used your application in the selected period of time.
Selecting "7 day active users" means to count the users that opened your software at least once per week.- 8. How many new installations do I have this period? (month, year, etc)
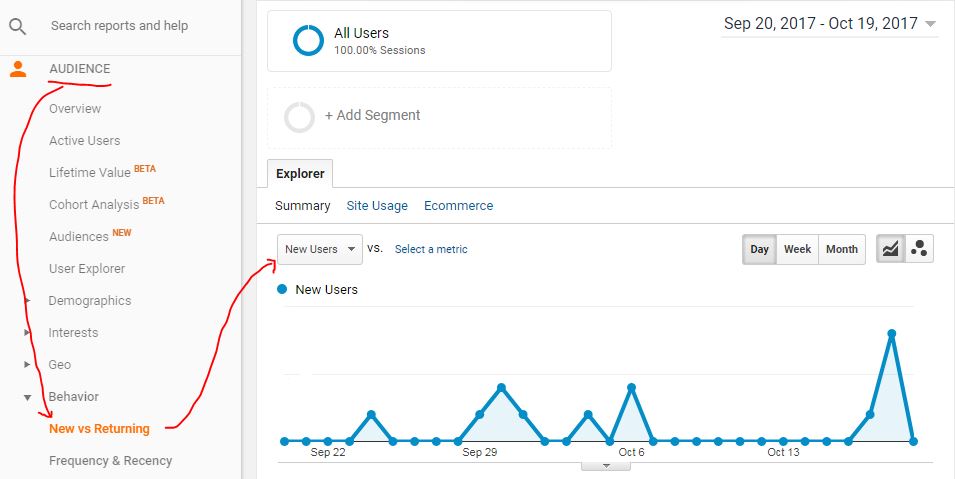
Reminder, every new user is a new installation for your shareware software.- 9. How many new vs active installations does my shareware have?
You can see the new and the existing installation in the same graph, so you can understand which peaks are due to new installations. You have to select "1 day" as the analysis parameter.- 10. What is the distribution of the various versions of my software?
- You can also add "app version" as a secondary dimension.
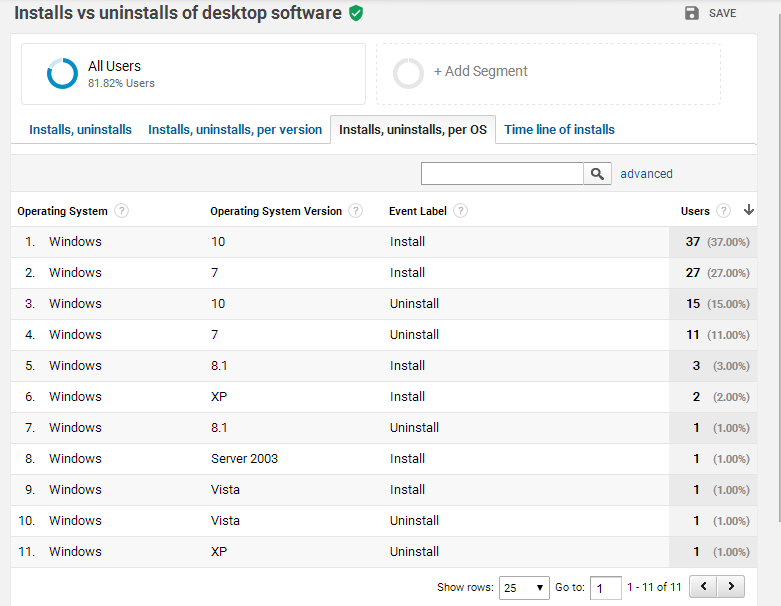
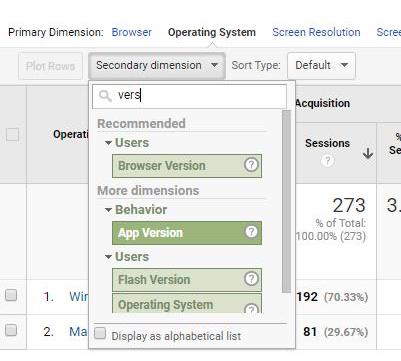
- 11. What are the operating systems my users have?
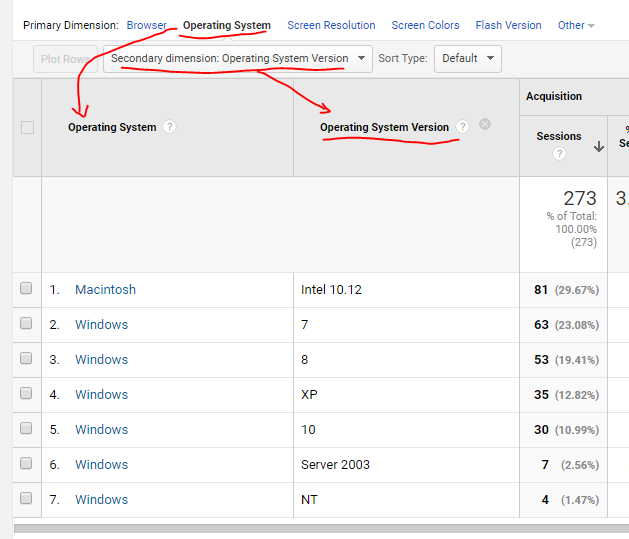
In Google Analytics, under the "Audience" section, go to the operating system tab and select "Operating system version" as a secondary dimension.- 12. What are their screen resolutions?
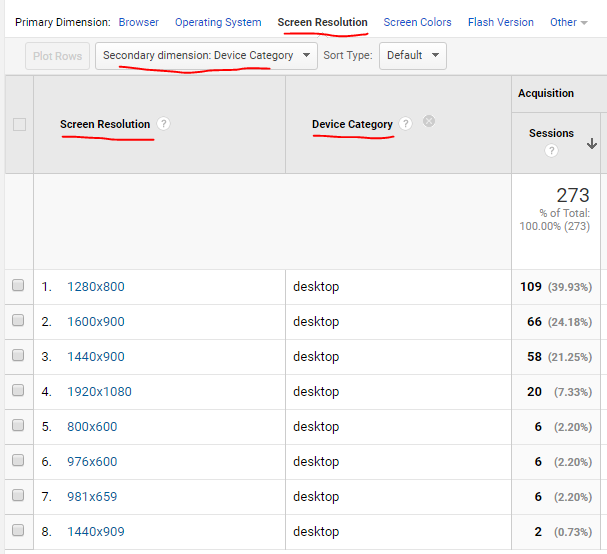
You can see the screen resolution and also the device category to better understand where each resolution comes from.
Add new comment